Dashboard
Overview
The Dashboard is a centralized interface that consolidates important analytics information of a Channel. In this section you have access to a summary of important metrics and statistics related to the platform's performance (at a Channel level), providing a quick snapshot of the platform's health and performance at a glance.
The dashboard contains graphs to present data in a visually appealing and easy-to-understand format to help administrators analyze trends, patterns, and insights related to user activity, content performance, and other relevant data points.
The Analytics Dashboard
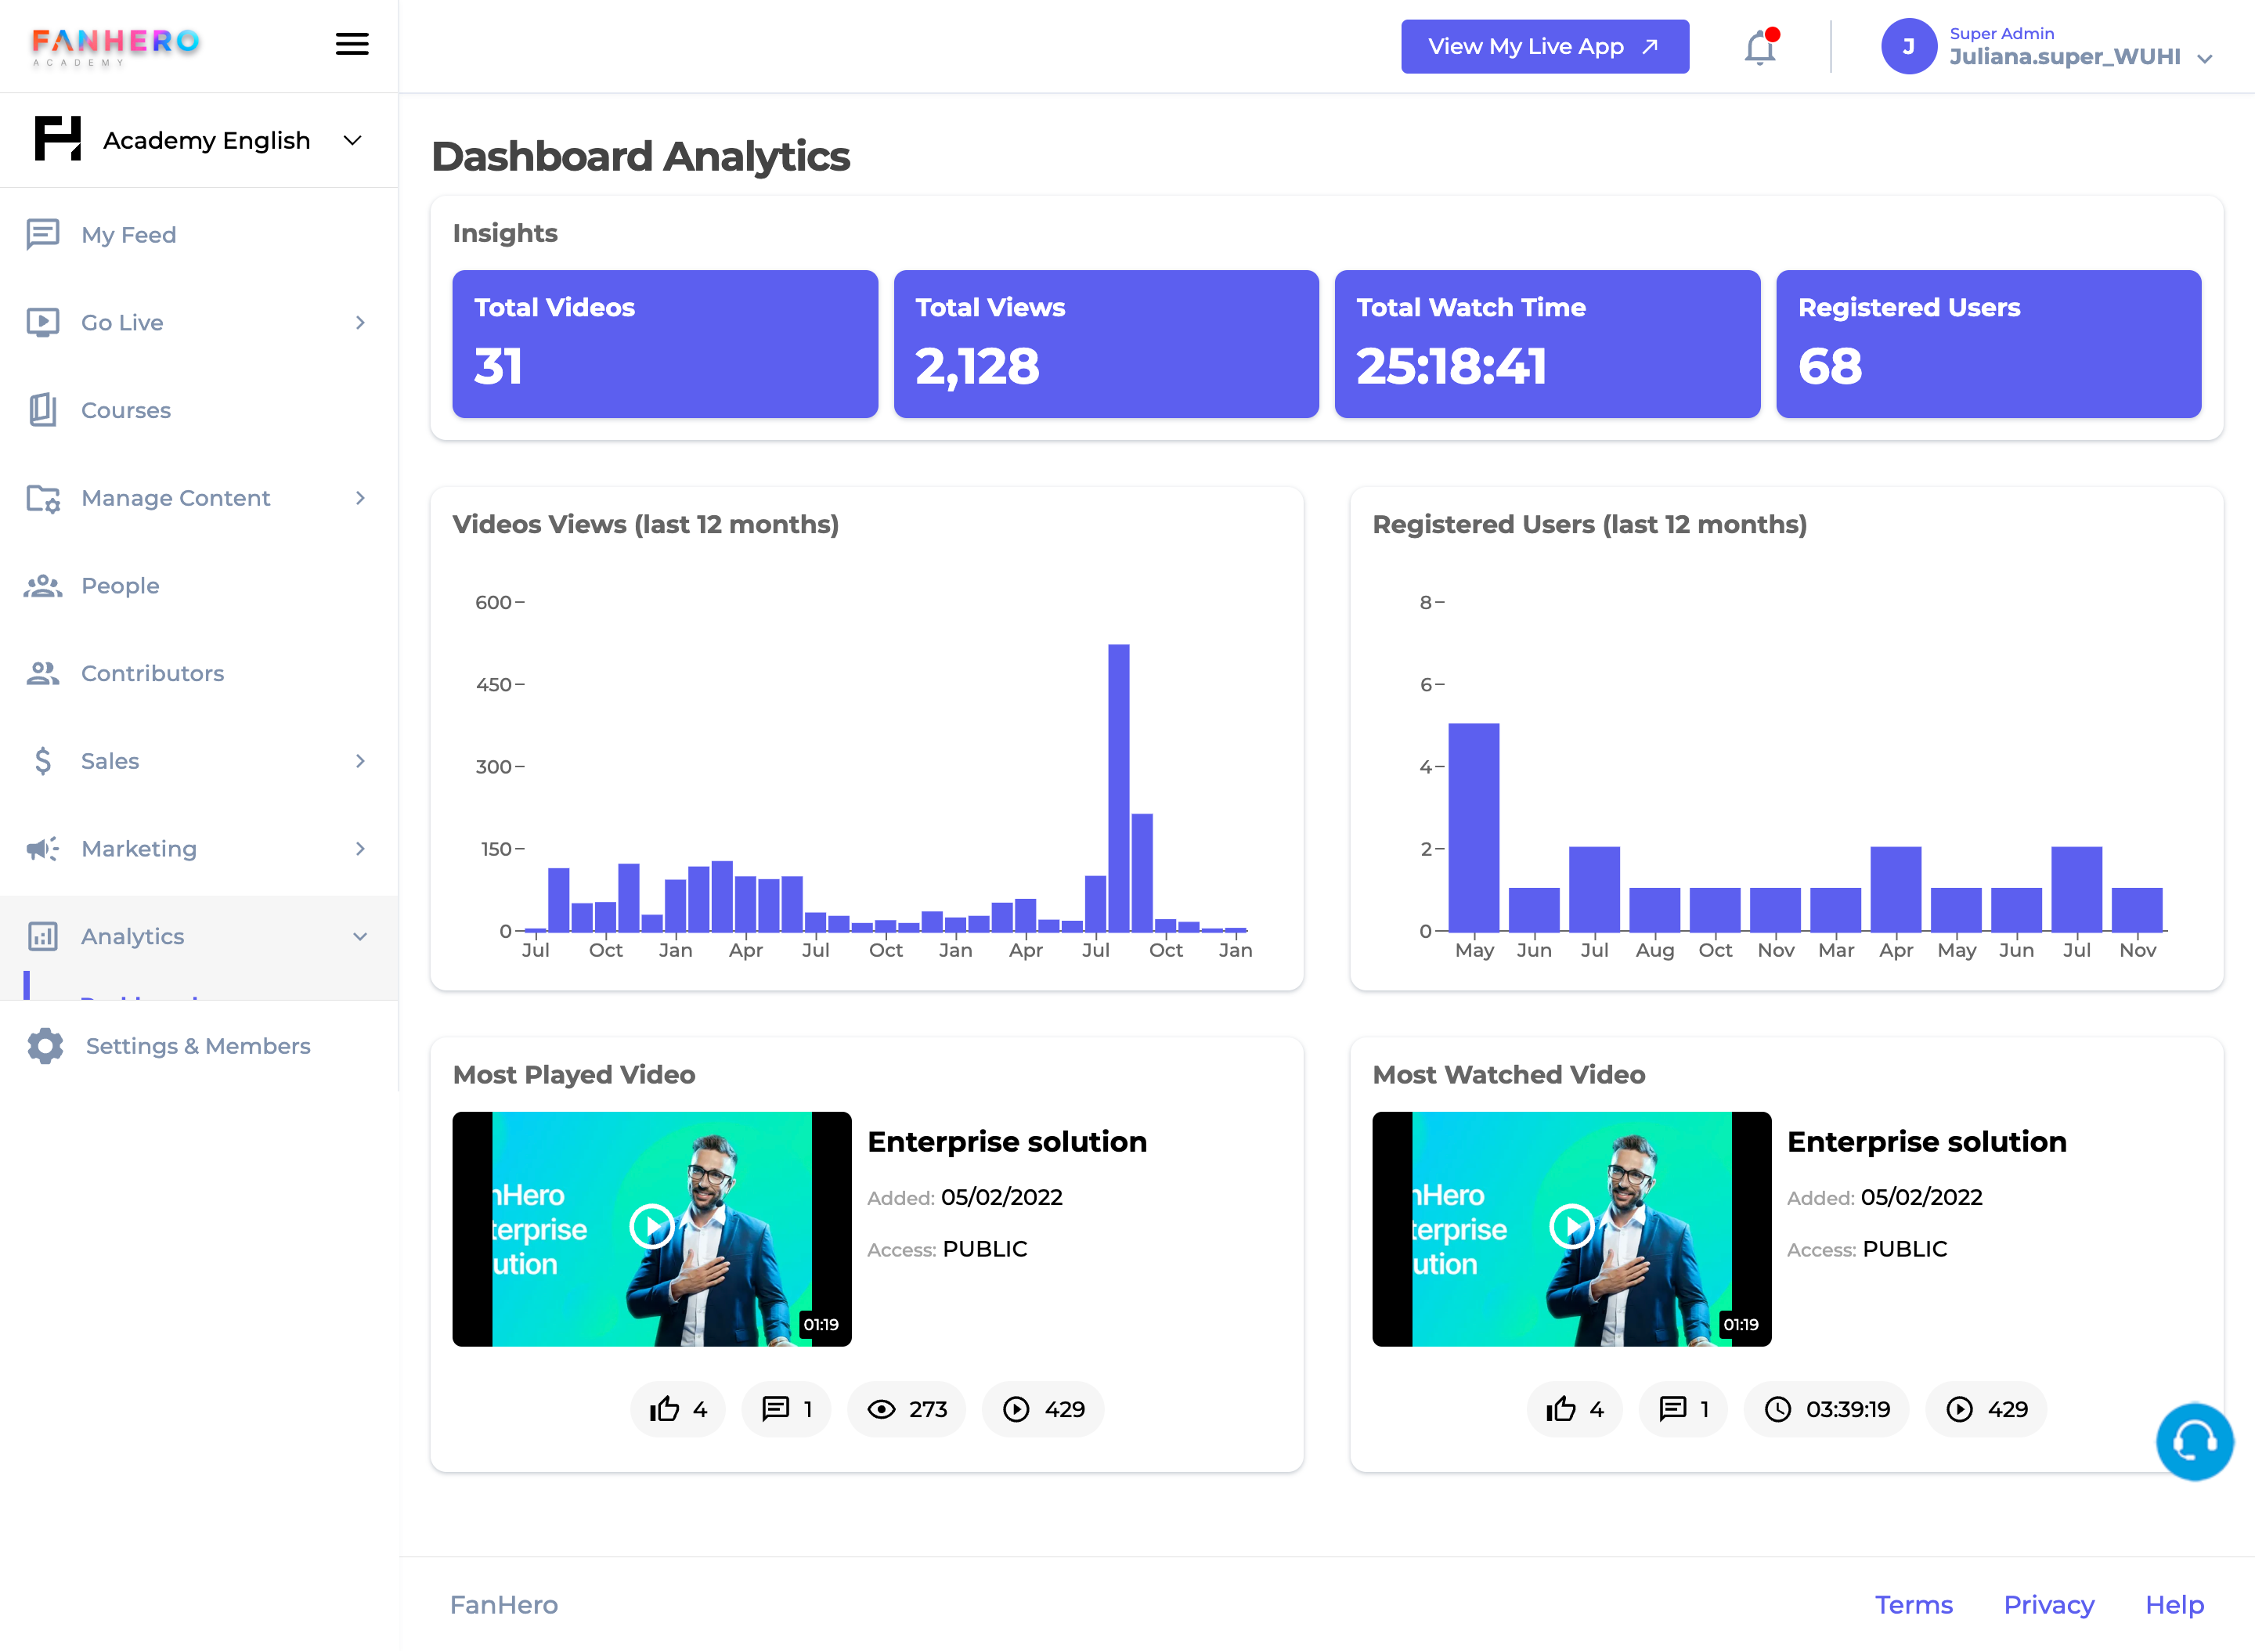
Insights
- Total Videos: The total number of published video posts on a channel.
- Total Views: The total number of views across all videos on a channel.
- Total Watch Time: The total watch time accumulated by the channel's videos.
- Registered Users: The total number of registered users in the organization.
Video Views
A graph providing a snapshot of the total number of views per month over the last 12 months.
Registered Users
A graph showing the total number of registered users per month over the last 12 months.
Most Played Video
A widget showcasing the most played video on a channel, based on the total number of plays (views).
Most Watched Video
A widget similar to the one above, displaying the most watched video on a channel, based on total watch time.
Level of Permission (Roles)
Available to Tenant, Super Admin, Admin and Analytics Specialist users.
Updated about 1 year ago